Data Outputs
EDGELIOT deliver a real-time Air Quality, Carbon Footprint and Weather monitor on a visualisation platform that is accessible from any Smart device via a secure login.
Measurements coupled with wind speed and direction allow us to pinpoint the exact location and intensity of emissions to guide and monitor policy decisions
We identify who is emitting, where and when are the emissions happening and how much is being emitted.
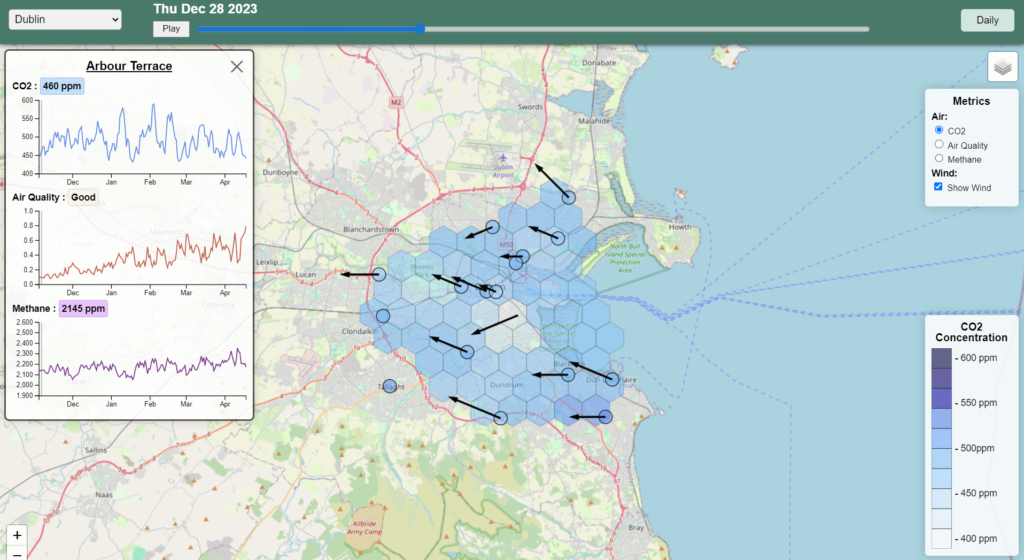
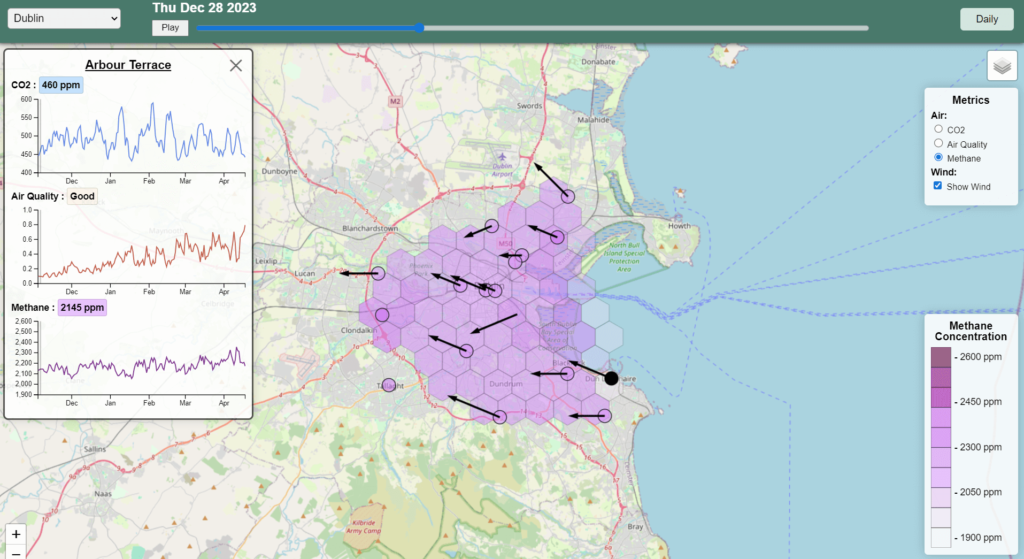
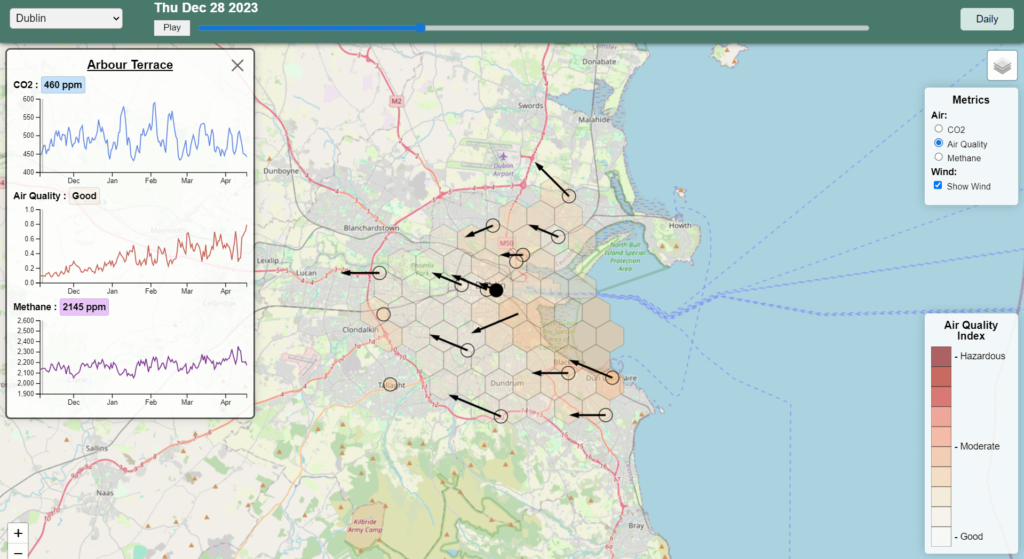
The following are an example of typical data plots:
The platform provides a real-time visualisation of the C02 Emissions across the Sensor Canopy along with the associated Wind Vectors

Methane emissions are also provided across the Sensor Canopy

A localised Air Quality Index is available in real-time.

The combined data provided is then used to identify areas across the canopy where emissions are highest and lowest.

